





By Mohammad Talha | Reviewed for accuracy | Last updated: July 2026
Candlestick patterns are visual signals on a price chart that show whether buyers or sellers were in control during a specific time period — and traders use them to anticipate what might happen next. If you’ve ever looked at a stock chart and wondered what those red and green bars actually mean, this guide breaks down every major pattern, what it signals, and how to actually use it without getting faked out.
This isn’t a “memorize 50 shapes” guide. Most of trading with candlesticks comes down to understanding a handful of patterns really well, knowing where they matter on a chart, and never trading them in isolation. Let’s start from the basics.
How to Read a Candlestick (The Anatomy)
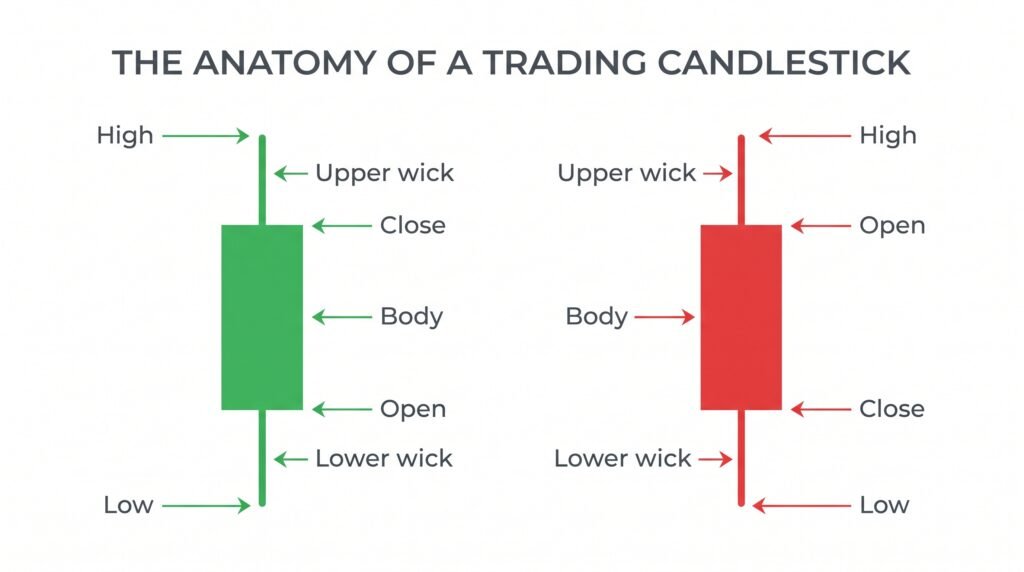
Every candlestick shows four prices for a given time period (a minute, an hour, a day — whatever timeframe you’re viewing):
- Open — the price when the period started
- Close — the price when the period ended
- High — the highest price reached during the period
- Low — the lowest price reached during the period
The thick part of the candle is called the body, and it represents the distance between the open and close. The thin lines above and below the body are called wicks (or shadows), and they show the high and low.
- If the close is higher than the open, the candle is usually shown green (or white) — buyers won that period.
- If the close is lower than the open, the candle is usually shown red (or black) — sellers won that period.
Understanding this candlestick chart structure is the foundation for everything else in this guide — every pattern below is really just a specific combination of body size, wick length, and color.
Bullish Reversal Candlestick Patterns
These patterns tend to show up after a downtrend and can signal that sellers are running out of steam.
Doji
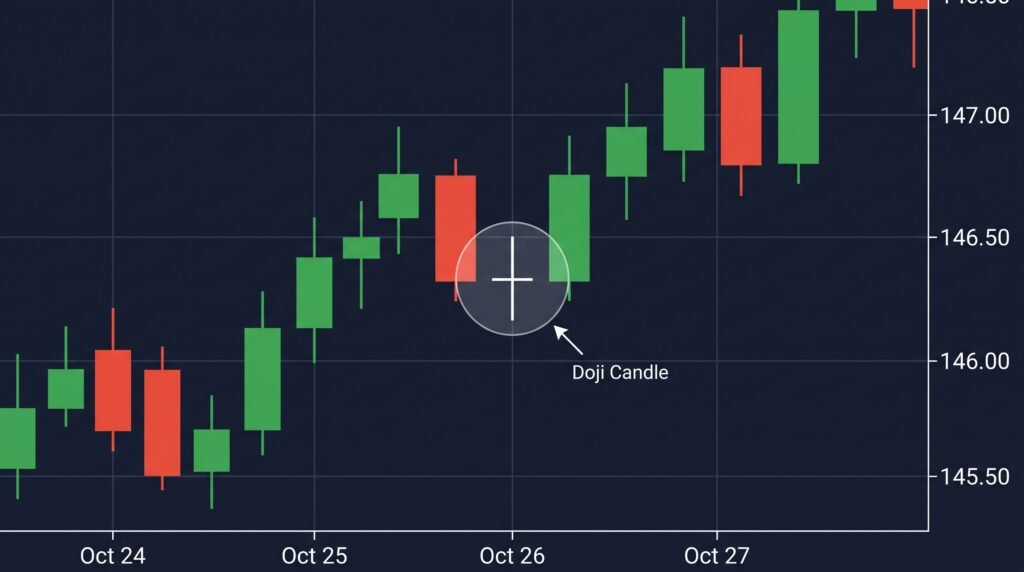
A doji forms when the open and close of a candle are almost identical, creating a very thin or nonexistent body with wicks on either side. It looks like a plus sign or a cross.
What it means: neither buyers nor sellers won that period — it’s a moment of pure indecision. On its own, a doji isn’t a signal to buy or sell. Its meaning depends entirely on context:
- A doji after a strong downtrend can hint that selling pressure is fading (potential bullish reversal).
- A doji after a strong uptrend can hint that buying pressure is fading (potential bearish reversal).
- A doji in the middle of a sideways, choppy market means almost nothing — this is where most beginners get faked out.
There are variations worth knowing: a dragonfly doji (long lower wick, little to no upper wick) is more bullish, while a gravestone doji (long upper wick, little to no lower wick) is more bearish.
Inverted Hammer
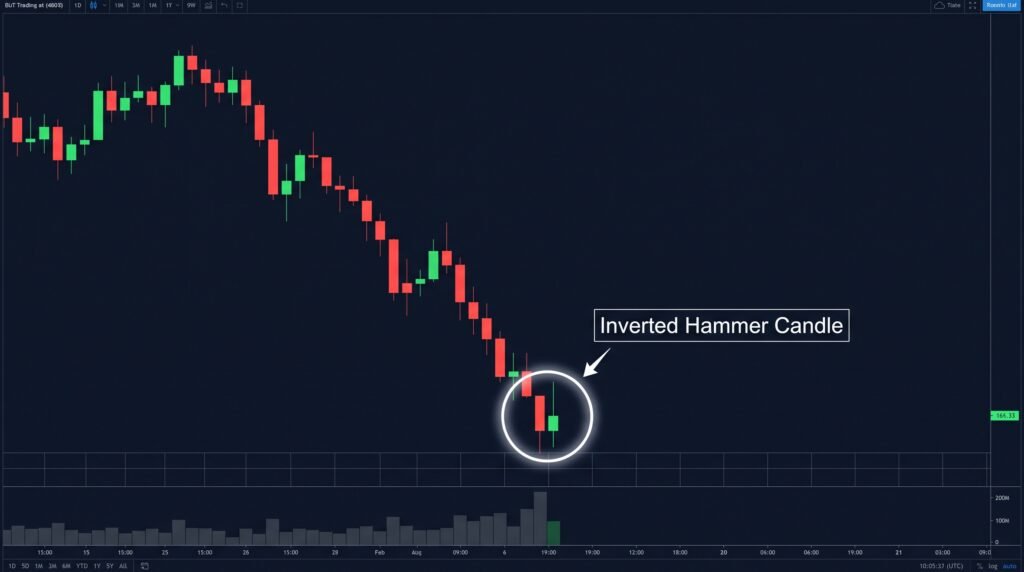
The inverted hammer has a small body near the bottom of the candle’s range with a long upper wick and little to no lower wick. It appears after a downtrend.
What it means: buyers tried to push price up significantly during the period (creating that long upper wick), and even though sellers pushed price back down by the close, the fact that buyers showed up at all is often read as early evidence that the downtrend is losing momentum.
Important nuance: an inverted hammer is not a buy signal by itself. Most traders wait for the next candle to close higher as confirmation before treating it as a real reversal.
Bearish Reversal Candlestick Patterns
These show up after an uptrend and can signal that buyers are losing control.
Shooting Star
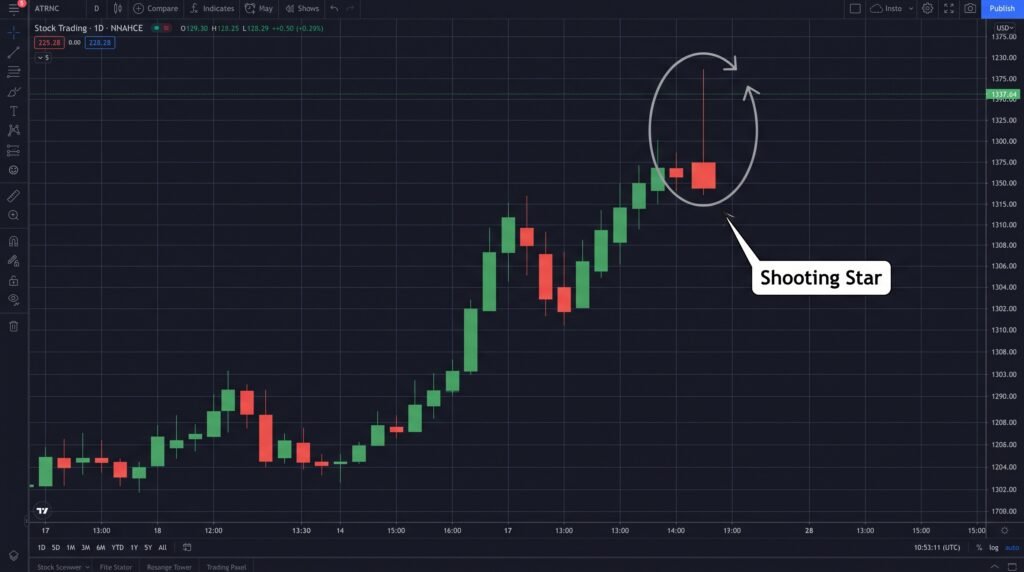
The shooting star is the bearish mirror image of the hammer: a small body near the bottom of the range, a long upper wick, and little to no lower wick — but it appears after an uptrend, not a downtrend.
What it means: price pushed up strongly during the period, but sellers stepped in and dragged it back down to close near the open. This is read as a sign that upward momentum is running out of steam at that price level, especially when it forms near a known resistance zone.
Evening Star
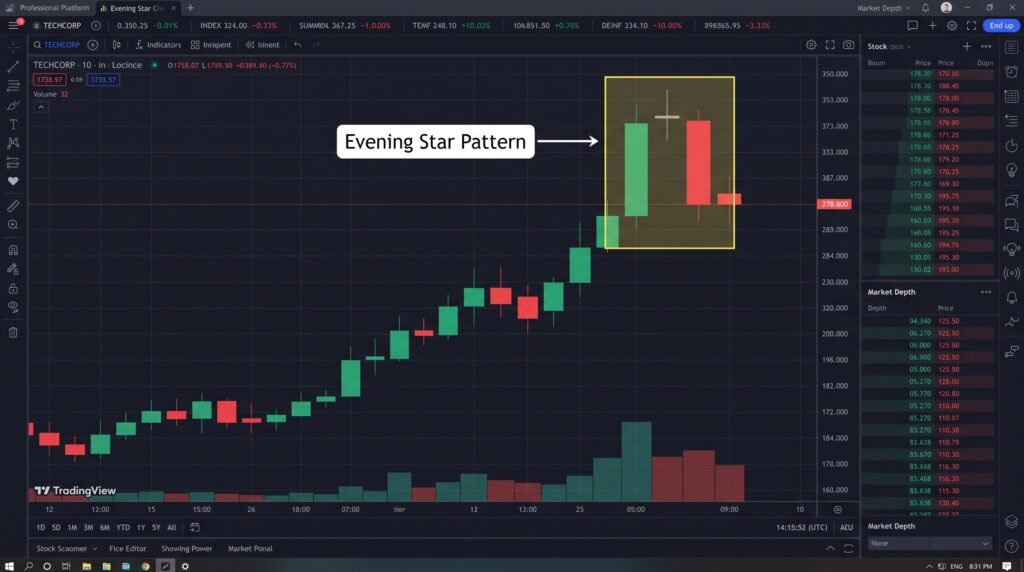
The evening star is a three-candle bearish reversal pattern:
- A large bullish (green) candle continuing the uptrend
- A small-bodied candle (can be bullish or bearish) that gaps up slightly, showing indecision
- A large bearish (red) candle that closes well into the body of the first candle
What it means: this pattern shows a clear shift in control — strong buying, then hesitation, then strong selling — which makes it one of the more reliable bearish reversal signals when it appears at the top of an established uptrend.
Reversal Candlestick Patterns: What Actually Makes One Reliable
Not every candlestick pattern that “looks textbook” actually plays out. Reversal candlestick patterns tend to be far more reliable when they show up alongside at least one of these confirming factors:
- Location matters — a pattern forming at a well-tested support or resistance level carries more weight than the same pattern in the middle of nowhere on the chart.
- Volume matters — a reversal pattern on unusually high volume suggests real conviction behind the move; low volume versions are easier to fake out.
- Confirmation matters — waiting for the next candle to close in the direction of the signal (instead of acting the instant the pattern forms) filters out a large percentage of false signals.
- Trend context matters — a bullish pattern only means something as a reversal signal if there was an actual downtrend to reverse. The same shape in a sideways market is mostly noise.
This is the single biggest mistake new traders make with candlestick patterns: treating every doji, hammer, or star as an automatic trade signal, instead of one piece of evidence that needs the surrounding context to mean anything.
How to Actually Use Candlestick Patterns in Trading
- Identify the existing trend first. A pattern only has “reversal” meaning if there’s a trend to reverse.
- Check the location. Is this pattern forming at support, resistance, or a key moving average? That context matters more than the pattern itself.
- Wait for confirmation. Let the next candle close in the direction the pattern suggests before acting.
- Check volume, if available. Higher volume on the signal candle adds credibility.
- Set a stop loss. Candlestick patterns give you a logical, low-risk point to place a stop (for example, just beyond the wick of a hammer or shooting star) — this keeps losses small on the trades that don’t work out.
- Never use a single candle in isolation. Combine candlestick signals with support/resistance levels, moving averages, or trendlines for a much higher-quality setup.
Candlestick Patterns Cheat Sheet
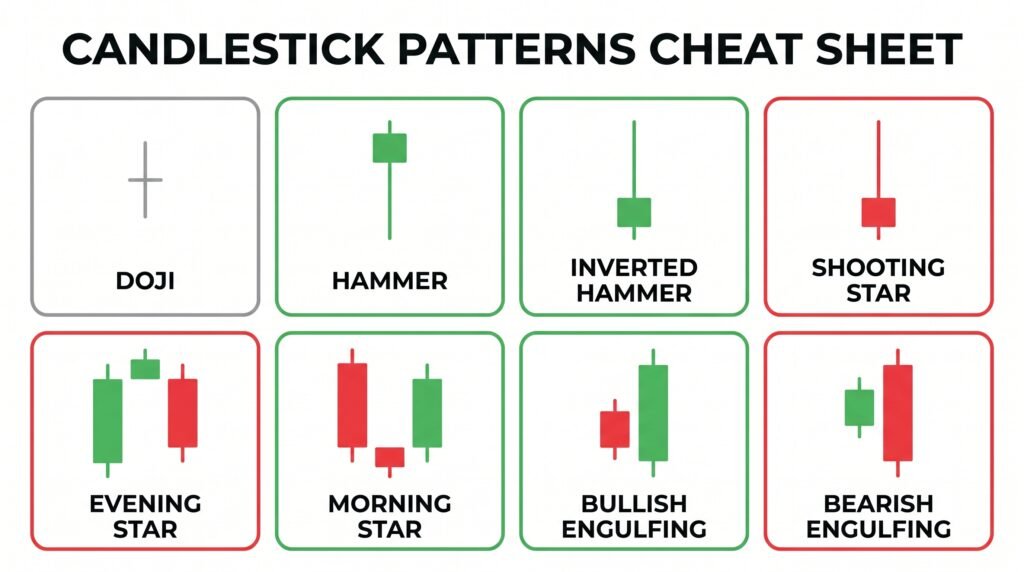
| Pattern | Type | Appears After | Key Feature |
|---|---|---|---|
| Doji | Neutral / Reversal | Any trend | Tiny body, open ≈ close |
| Dragonfly Doji | Bullish | Downtrend | Long lower wick, no upper wick |
| Gravestone Doji | Bearish | Uptrend | Long upper wick, no lower wick |
| Inverted Hammer | Bullish reversal | Downtrend | Small body, long upper wick |
| Hammer | Bullish reversal | Downtrend | Small body, long lower wick |
| Shooting Star | Bearish reversal | Uptrend | Small body, long upper wick |
| Evening Star | Bearish reversal (3-candle) | Uptrend | Big green → small → big red |
| Morning Star | Bullish reversal (3-candle) | Downtrend | Big red → small → big green |
| Bullish Engulfing | Bullish reversal | Downtrend | Green candle fully engulfs prior red candle |
| Bearish Engulfing | Bearish reversal | Uptrend | Red candle fully engulfs prior green candle |
Save this table or take a screenshot for quick reference — a full printable candlestick patterns PDF version of this cheat sheet is coming soon.
Common Mistakes Traders Make With Candlestick Patterns
- Trading every single pattern — most candles are just noise; only a handful of setups per week are actually worth acting on.
- Ignoring the broader trend — a “bullish” pattern in a strong downtrend is far less reliable than the same pattern at a genuine support level.
- Skipping confirmation — acting the moment a pattern forms, instead of waiting for the next candle to confirm it.
- Using candlesticks on tiny timeframes without context — patterns on a 1-minute chart are far noisier and less reliable than the same pattern on a daily chart.
- No risk management — even a well-confirmed pattern fails sometimes; always trade with a predefined stop loss.
Frequently Asked Questions
What is the most reliable candlestick pattern? No single pattern is reliable 100% of the time, but engulfing patterns and evening/morning star formations tend to have stronger track records than single-candle patterns like a plain doji, because they show a clearer shift in buyer/seller control across multiple periods.
What does a doji candlestick mean? A doji means the market opened and closed at nearly the same price, signaling indecision between buyers and sellers. Its bullish or bearish implication depends on where it appears — after a downtrend, an uptrend, or in a sideways market.
Is a shooting star bullish or bearish? A shooting star is a bearish reversal signal. It appears after an uptrend and suggests that buying momentum is fading at that price level.
How do I know if a candlestick pattern is confirmed? Most traders wait for the next candle to close in the direction the pattern suggests — for example, waiting for a green candle to close above a hammer’s high before treating it as a confirmed bullish signal.
Do candlestick patterns work on all timeframes? They can appear on any timeframe, but they tend to be more reliable on higher timeframes (daily, 4-hour) than on very short timeframes (1-minute, 5-minute), where random price noise creates far more false patterns.
Disclaimer: This article is for educational purposes only and does not constitute financial or investment advice. Trading involves risk, including the potential loss of principal. Always do your own research or consult a licensed financial advisor before making trading decisions.
Related reading: Stock Market for Beginners | Best Day Trading Platforms for Beginners | Swing Trading Strategy Guide